CONNECT WITH
CUSTOMERS
RIGHT WHEN & WHERE THEY ARE MAKING THE PURCHASE DECISION


CONNECT WITH
CUSTOMERS
RIGHT WHEN & WHERE THEY ARE MAKING THE PURCHASE DECISION

GROW YOUR SALES AND increase visibility on the digital shelf


272.7 M
Webshop Users
in 2022

70.5 M
Unique Searches
in 2022

1.8 BN
Online Sales

500 – 2000%
SPA ROAS
ROAS
TOP OF PAGE = TOP OF MIND
Improve your ranking and put your product in the spotlight.
RELEVANCE & BEHAVIOUR
Reach users with a fitting search history and habits in different touchpoints.

Personalised product
recommendation

Reach high intent
shoppers

Attribute Sales

Drive traffic to
your PDPs

Automated
keyword model

High ROAS

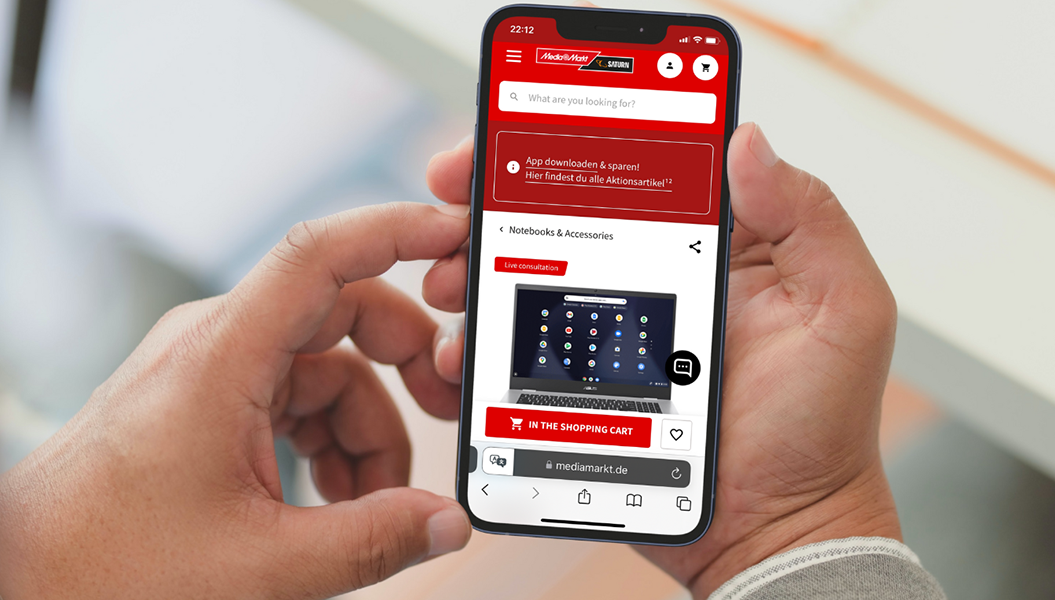
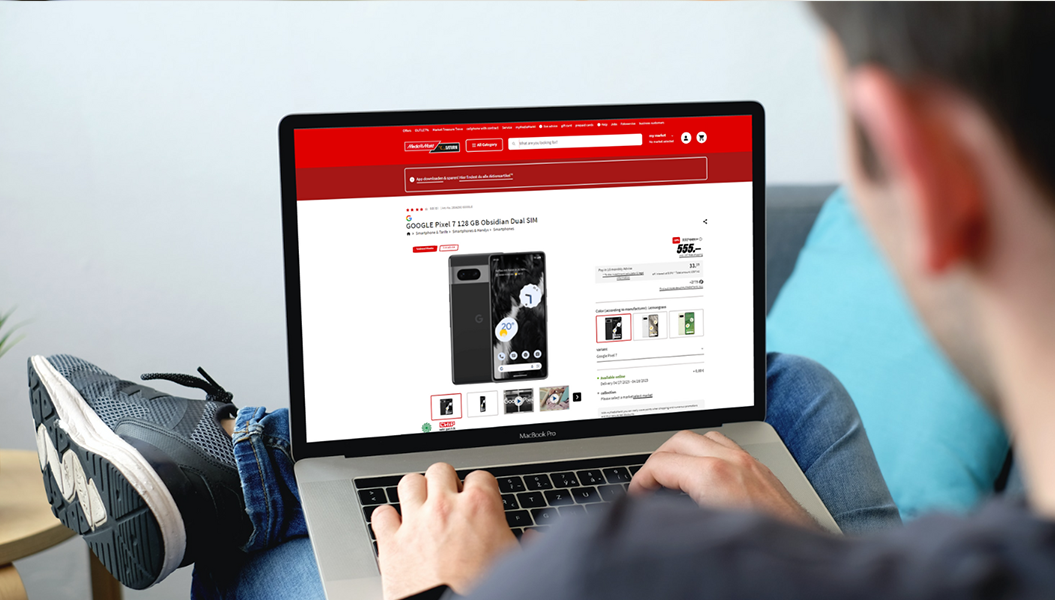
SPA Places your product at the top of the 1st result-page!

The customer searches or browses a category page
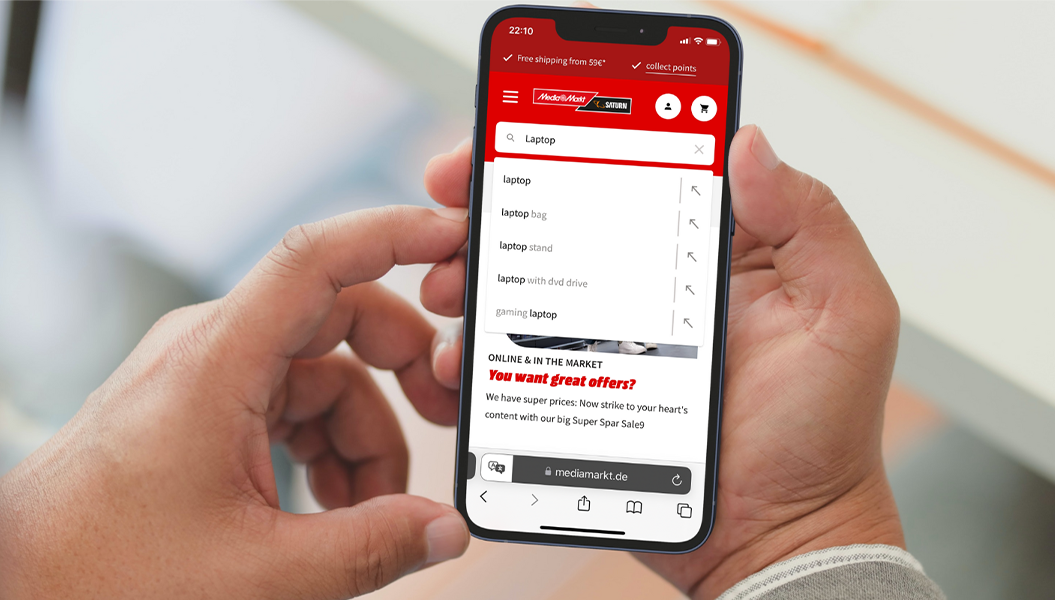

The algorithm destermines the best SKU to place in the SPA
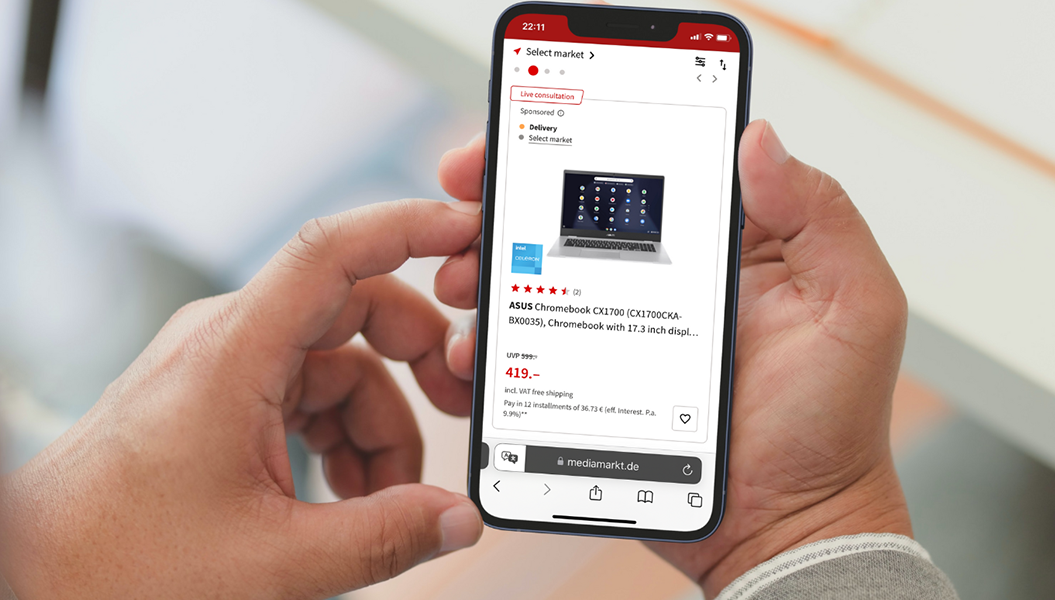

The customer clicks and is taken to the product Detail page for purchase

increase your brand awareness
& generate new leads

272.7 M
Webshop Users
in 2022
70.5 M
Unique Searches
in 2022
1.8 BN
Online Sales
We promote your brand with appealing display ads through our channels to millons of active users
SBA allows you to grow your market share by growing your brand awareness and relevance.

Share your brand story
with your audience.

Be part of the
conversation and engage
with your customers

Cultivate a strong
brand presence.

The customer is browsing our webshop and sees the attractive SBA
You choose the Environment and time period of the SBA

The customer clicks on the SBA and is taken to the product Detail page for purchase

grow your sales by providing an engaging customer centric experience on your pdp
WITHOUT A+ CONTENT
WITH A+ CONTENT
+ 13%
Add to Cart Rate
5.04%
Purchase Rate
More space in your product detail page to include all the arguments and visuals that will convince the user that your product is the right one and crush the competition.

Deep dive on all
product features

Images, Text, Virtual
Reality, Video Content

Available for all SKUs
of a brand

Engaging, emotional visuals to
showcase the performance
Turn dry product Information into an emotional customer centric experience
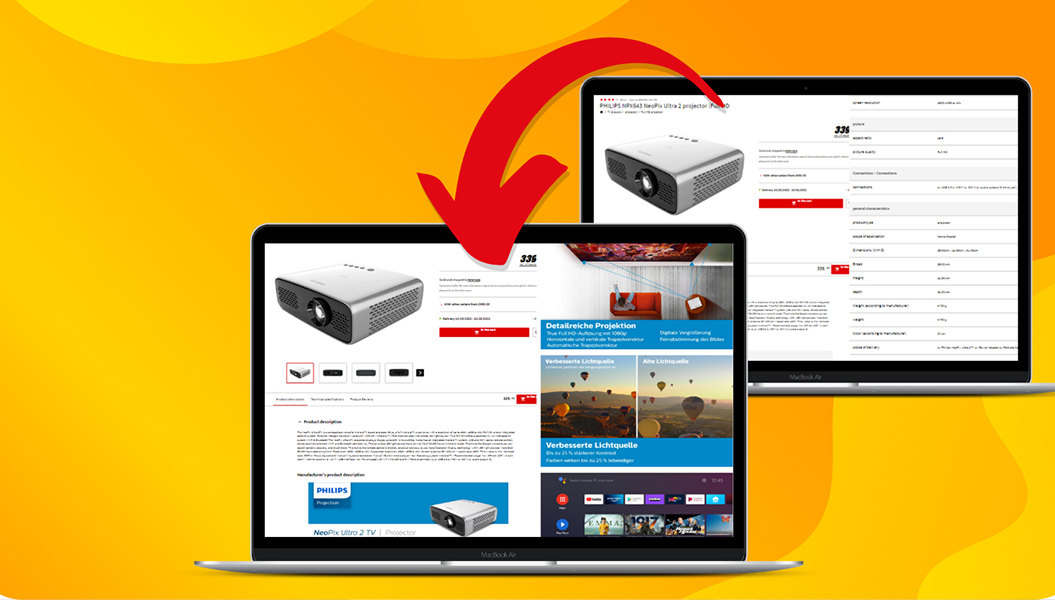
With Videos, Images and product comparisons, you can spark emotions and engage customers
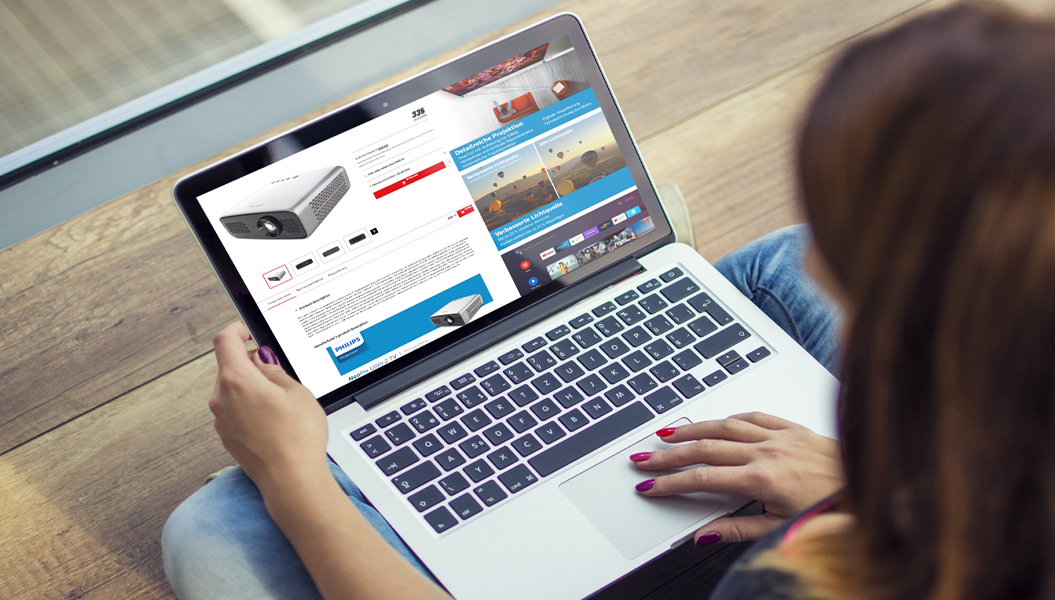
A+ Content improves your sales revenue by 14 to 21%

– to guide your customers to your products (SPA)
– to present your products as attractive as possible (A+ Content)

get access to all data & insights to make data-driven decisions in real time with our reporting solutions
CONSIDERATION REPORT
ACTION REPORT

Evaluate and assess your per-formance and compare with the average and the top performers in your category.

Understand what consumers are looking for through PDP behaviour analysis.

Get access to:
- Detailed KPI dashboard
- Competitive benchmarking
- Consumer behaviour insights
And more…
Get all the insights you need to make data-driven decisions to grow your sales and market share